|
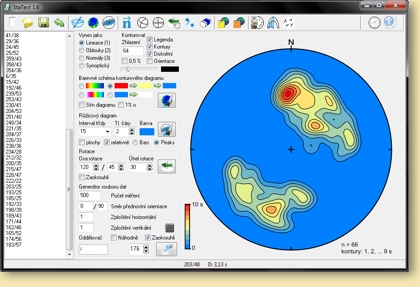
 StaTect is a simple application for compass data plotting and statistical analysis. It can plot data as points (poles), great circles or both ways (used e.g. for faults etc.), compute rose and contoured plots (using all your CPU-threads), rotate and generate data. All plots are in equal-area projection on lower hemisphere and are generated as bitmaps and metafiles. StaTect is a simple application for compass data plotting and statistical analysis. It can plot data as points (poles), great circles or both ways (used e.g. for faults etc.), compute rose and contoured plots (using all your CPU-threads), rotate and generate data. All plots are in equal-area projection on lower hemisphere and are generated as bitmaps and metafiles.
StaTect can be used and distributed only for non-commercial purposes!
If you are looking for similar application for commercial activities, try e.g. SpheriStat or some of these here.
If you like StaTect, tell your friends/colleagues! You can also cite StaTect and this page in your texts...
|